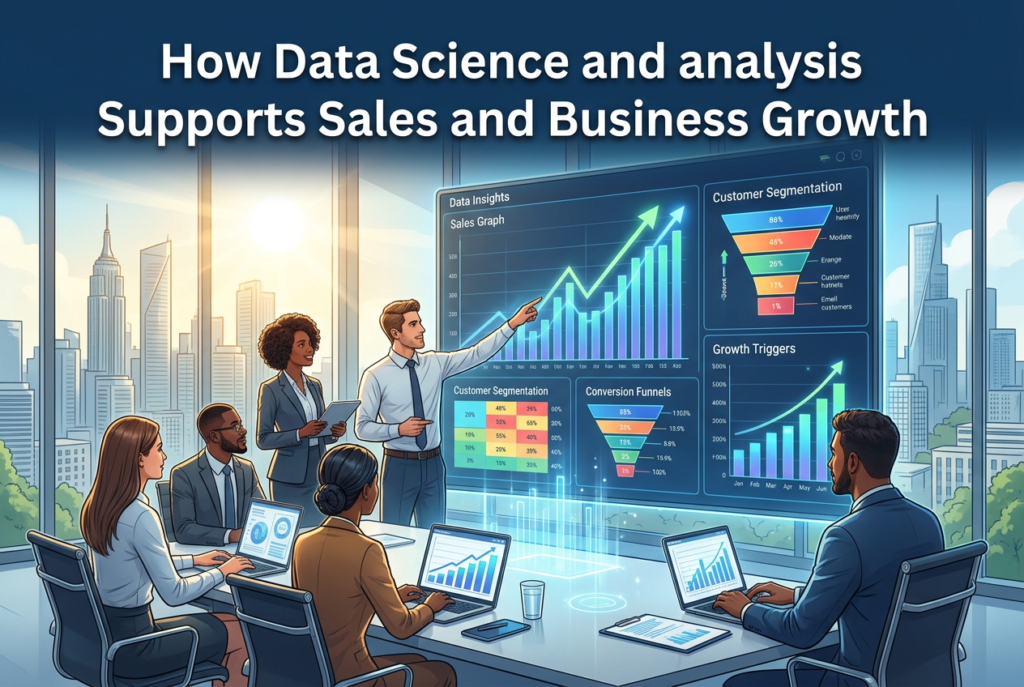
Businesses need reliable information to understand sales performance, identify opportunities and plan for growth. Sales figures alone rarely explain why performance changes. Organisations often need to examine customer behaviour, conversion rates, product demand and market conditions to understand what is happening.
Data science and data analysis can help businesses turn these records into useful insights. By examining historical results, identifying patterns and presenting findings clearly, teams can make more informed decisions about sales strategies and business priorities.
Understanding Data Analysis in Sales
Data analysis involves collecting, organising and examining information to answer a specific question. In sales, this might mean understanding which products generate the most revenue, which customer groups make repeat purchases or where leads are being lost.
Data science can extend this work through statistical modelling and machine learning when the problem requires more advanced analysis. For example, a business may use historical sales information to estimate future demand.
The choice of method should depend on the business question, data quality and resources available. A straightforward report can sometimes be more useful than a complicated model.
1. Measuring Sales Performance
Sales teams track metrics such as revenue, average order value, conversion rate, repeat purchases and sales cycle length. Examining these measures over time helps managers understand whether performance is improving or declining.
For example, an organisation may generate more website enquiries but see no increase in completed sales. Analysing lead quality, follow-up time and conversion by channel may reveal where the process needs attention.
Metrics should be defined consistently. If different teams calculate conversion rates differently, their reports may lead to conflicting conclusions.
2. Improving Sales Forecasting
Sales forecasting helps businesses estimate future revenue and plan staffing, inventory and budgets. Historical sales records can provide a starting point, particularly when they cover multiple seasons and market conditions.
An analyst may compare monthly revenue, product demand and regional performance to identify recurring patterns. More advanced models can incorporate additional variables, but forecasts remain estimates rather than guarantees.
Unexpected events, pricing changes, competitor activity and shifts in customer demand can all affect outcomes. Businesses should compare forecasts with actual results and revise assumptions when necessary.
3. Understanding Customer Behaviour
Customer data can help sales teams understand what customers purchase, how frequently they return and which products are often bought together.
A company might discover that customers who purchase one product frequently return for a complementary service. The sales team could use this insight to improve product information or develop relevant offers.
Customer segmentation can also help businesses tailor their approach. However, segmentation should be based on appropriate data and should not rely on unsupported assumptions about individuals.
4. Improving Marketing and Sales Coordination
Marketing teams generate leads through websites, search engines, social media, email and other channels. Sales teams then work to convert suitable prospects into customers.
Analysing the complete journey can help both teams understand which channels produce meaningful business outcomes. A campaign that attracts many visitors may not necessarily generate qualified leads, while a smaller campaign may bring prospects who are more likely to purchase.
Shared reporting can improve coordination by showing lead sources, response times, conversion rates and customer acquisition costs.
5. Using Dashboards to Communicate Findings
Dashboards allow managers to monitor important sales indicators without manually combining multiple reports. Tools such as Power BI and Tableau can help present trends, comparisons and performance measures.
A useful dashboard should answer clear questions, display relevant metrics and make unusual changes easy to investigate. Too many charts or poorly defined measures can make the information harder to use.
Data visualisation should support a decision, not merely make a report look attractive.
6. Building the Right Analytical Skills
Sales analytics may involve spreadsheets, SQL, Python, statistics and business intelligence tools. The required skills depend on the complexity of the work.
A beginner can practise by analysing a sample sales dataset, calculating monthly growth, comparing product categories and creating a dashboard. The next step is to explain what the results mean for a business and acknowledge any limitations.
People considering formal data science training, including programs offered by NUCOT, should evaluate curriculum coverage, project opportunities and support arrangements before enrolling. Training can support skill development, but employment outcomes depend on individual readiness and employer requirements.
Conclusion
Data science and data analysis can support sales and business growth by improving performance measurement, forecasting, customer understanding and coordination between marketing and sales teams.
Businesses should begin with a clear question, use reliable data and select appropriate analytical methods. When findings are communicated clearly and reviewed regularly, data becomes a practical resource for improving decisions rather than just another reporting requirement.